Heatmaps: Visual Insights to View User’s Mind

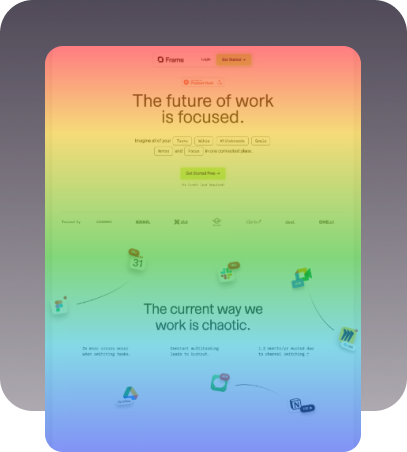
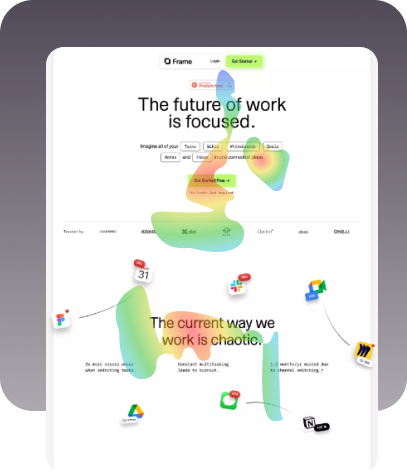
Heatmaps are visual insights showing you what your users are doing after visiting your site. Yes, you can know exactly where visitors focus their attention, where they click, and how far they scroll.
Learn more about how this product analytics tool helps you to know your customers deeper.


Combine Heatmap with Other Analytics Tools & See the Magic

Potential Targeting
Trigger heatmaps based on what your users do and who they are. Go for potential improvements targeting these actions.

User Engagement Tracking
Get clear insights into the user’s choice. Track clicks, scrolls, and every move to understand the user’s journey.

Smart & Instant Visuals
Get visual data instant. Advanced features help to get insights about users’ behavior with just a click.

Customizable Privacy Settings
Blur sensitive info like content, images, password fields, and/or specific CSS selectors and keep user’s data safe.

Time-Frame Filtering
Check user data from different times. Filter heatmap data to see what’s really working and how user behavior changes over time.

Playback Functionality
Watch your users’ actions using the replay feature to understand user’s actions and clear concept better.
Types of Heatmaps


Get an Instant Picture of User Intent Without Tech Skill


With Heatmaps, you can get visual data about user behavior that traditional analytics can’t reveal and boost conversion. And the best part is no critical setup or technical expertise is needed for this.
Just pick a page or URL and define instant data showing exactly where to focus your improvement efforts.