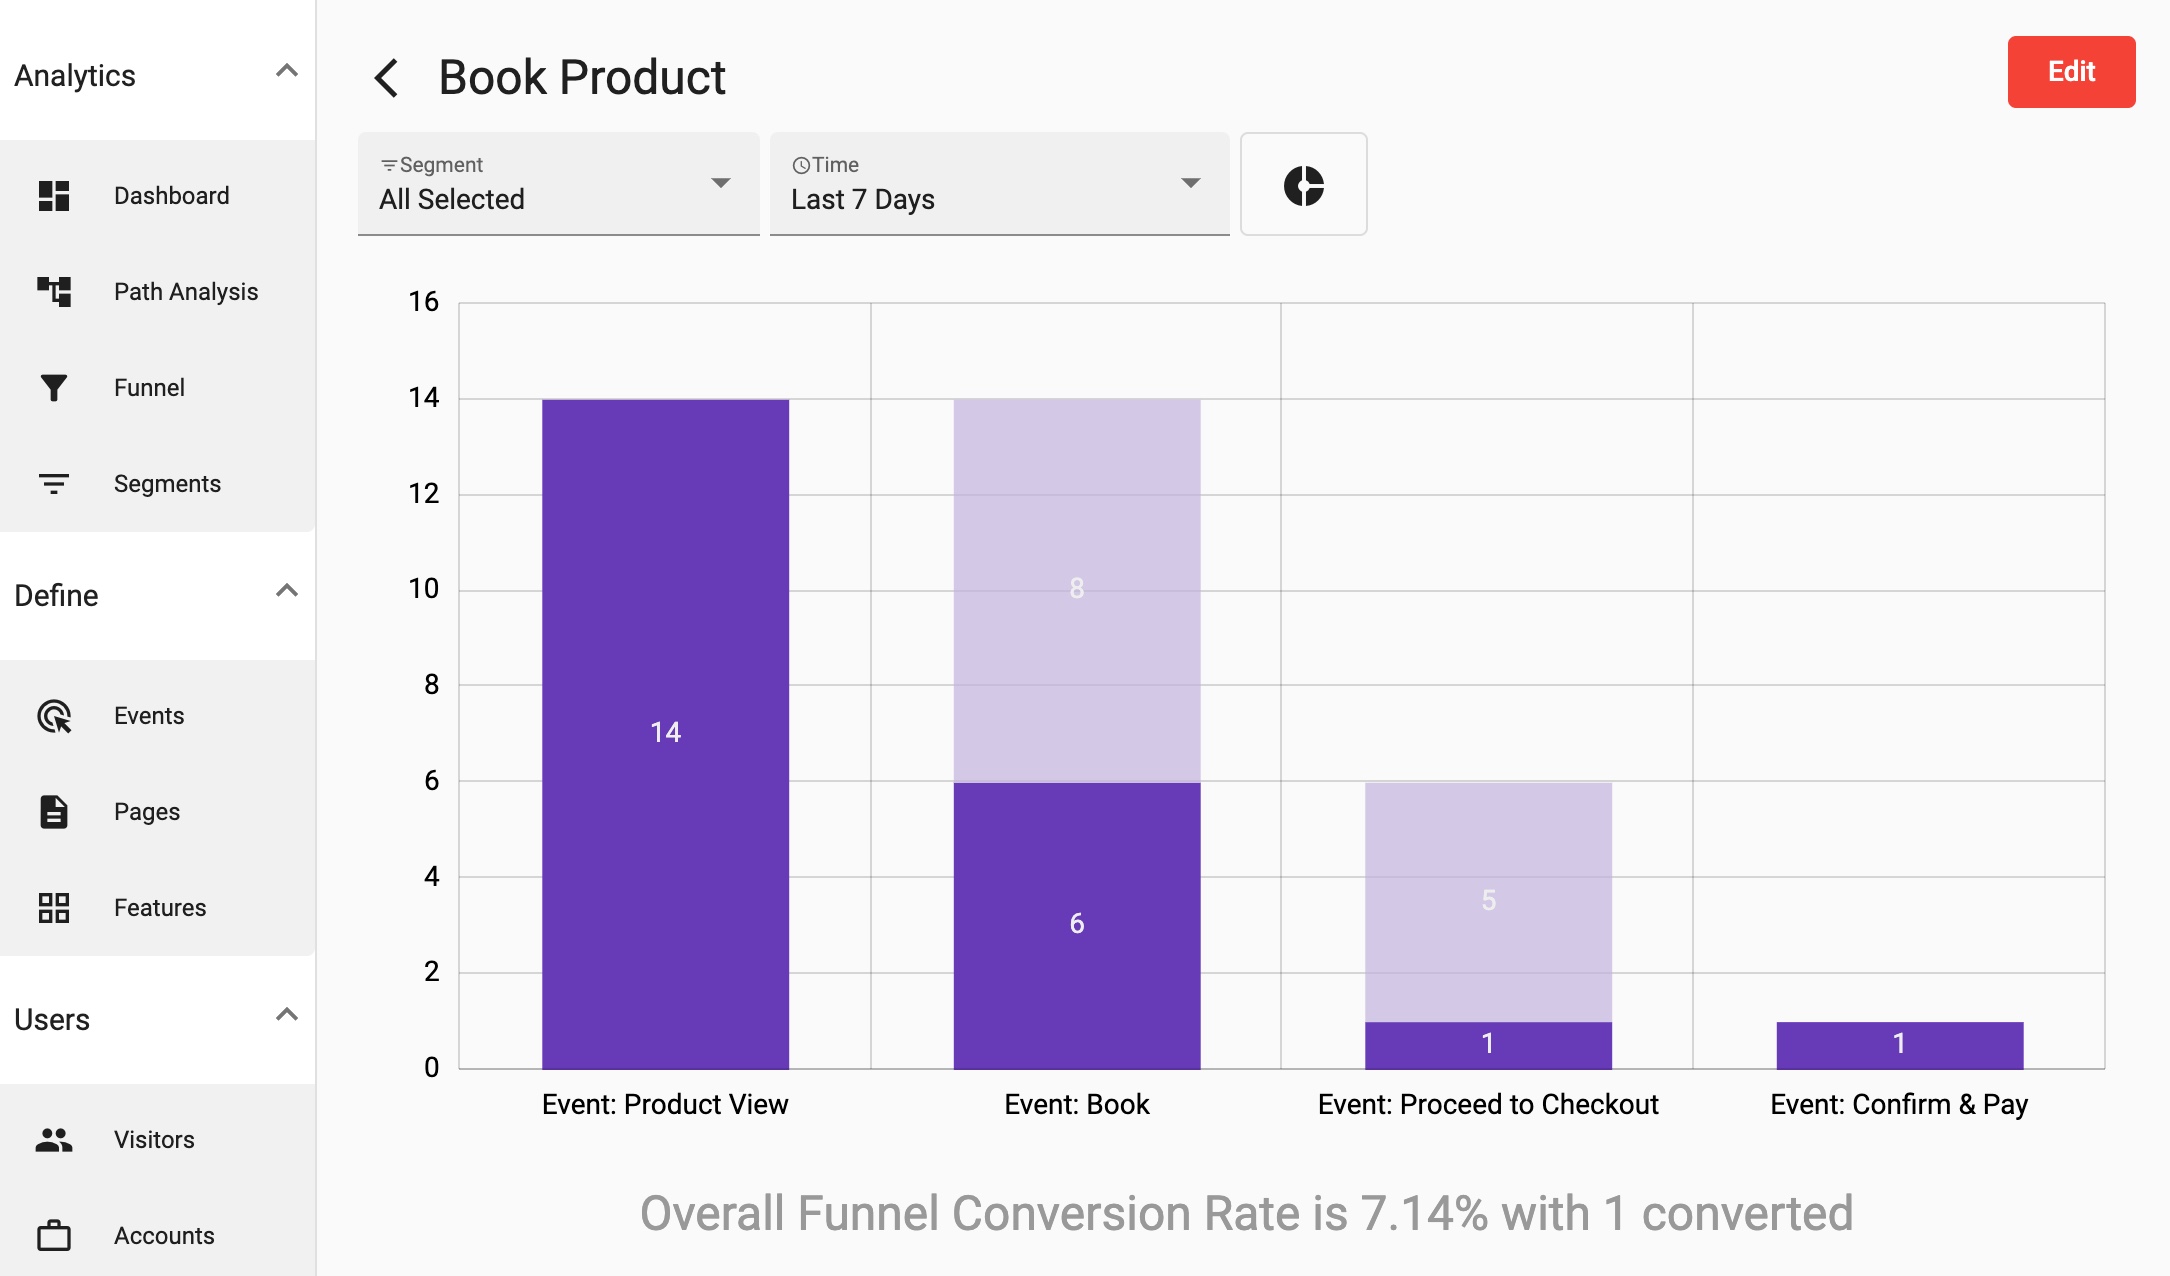
Create funnels for your critical features. Once you do that you can start analyzing the conversion rates for different funnels. You can then breakdown by cohorts.
Create funnels for your critical features. Once you do that you can start analyzing the conversion rates for different funnels. You can then breakdown by cohorts.

Cohort analytics provides powerful, personalized insights to your product development teams by defining segments of customers based on common experiences and essential characteristics.
Define your cohorts once and use them across the platform.


Understand every user behavior through visual charts and reports. Slice and dice any chart, a report by the user agent, event, or visitor properties to understand churn and dropouts. Use cohorts to group your users further and understand product usage patterns.
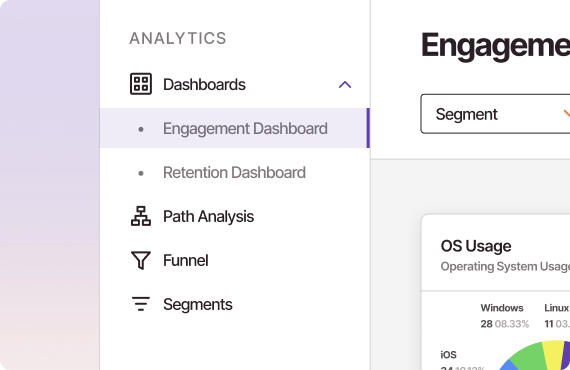
Understand user patterns to identify trends that will shape your product for success. Create segments on any attribute, property, or cohort and dive deeper to understand engagement drivers. Save your segments and use them in any reports.


Track the customer journey and group your users by attributes to create customer personas. Monitor actions like account cancelation and activation by understanding adoption trends. Profile the correct customers for upsell opportunities and reduce churn.
Boost retention by 50% by understanding user dropout patterns. Discover dropout trends and narrow down where your product teams need to spend energy and resources. Re-engage dropped users by making the right product changes and reaching out back to the users.

Join companies that have successfully reduced their churn rate by up to 40% using StatWide’s predictive analytics.