
Customer Lifecycle Vs Customer Journey – What’s The Differences
Customer Lifecycle Is a Complete Cycle of the Customer with the Business whereas Customer Journey focuses on specific paths or interactions. Assume a customer lifecycle
Worried about knowing how to calculate month-over-month growth for your organization? The expressions month-over-month, year-over-year, and quarter-over-quarter are all used to compare the rates of growth and change between two comparable time periods.
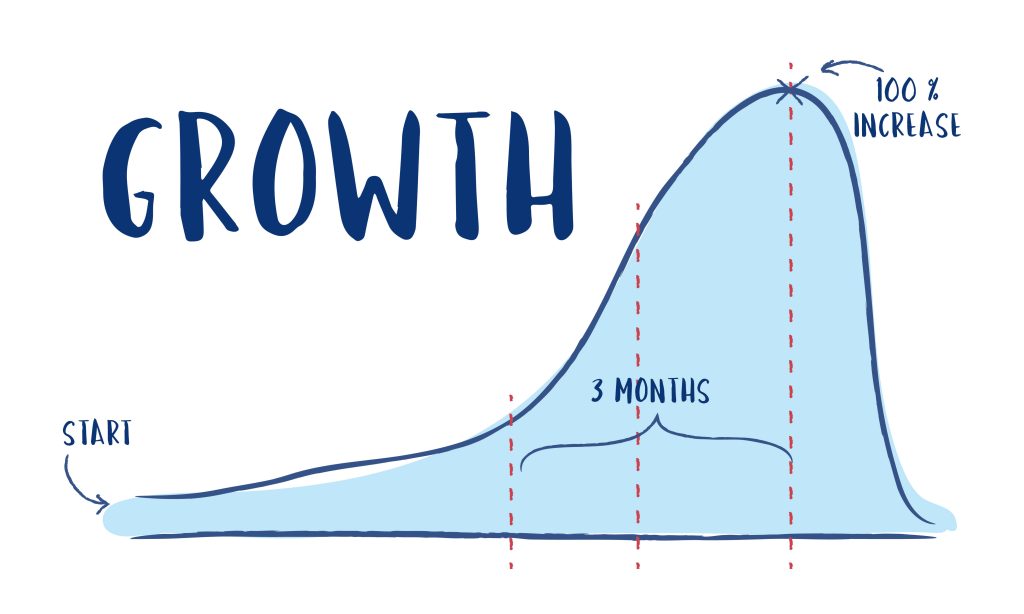
One of the best signs that you have perfected product-market fit is exponential growth. When determining whether to invest in a company, it’s one of the first patterns that investors look for. It’s also one of the most difficult metric results to accomplish.
In this article, you will easily understand what is month-over-month growth, the formula for calculating month-over-month growth, and step-by-step directions on how to calculate month-over-month growth.
The smallest unit of measurement for accurately measuring a business’s rate of growth is month-over-month (MoM). The growth rate of monthly revenue, active users, the number of subscriptions, and other important metrics are frequently gauged using month-over-month growth. It is one of the most effective ways to discuss the traction and success of your product or business.
To provide you with an understanding of growth rates over different time frames, this statistic scales up to Quarter on Quarter and Year on Year growth track. Early-stage businesses, like the founders of San Francisco startup enterprises, most frequently use it for estimates. So if you’re working on a digital product like a website, mobile app, or SaaS product, you probably care about it.
A measurement that represents more general growth marketing patterns is the percentage rise over a specific period. Your month-over-month growth metrics can be calculated using either the monthly growth rate or the compound monthly growth rate.
The formula for calculating Month-Over-Month (MoM) is
Month-Over-Month Growth (MoM) = Current Month Value Prior Month Value – 1
Another formula for calculating Month-Over-Month (MoM) is
Month-Over-Month (MoM) Growth = (Current Month Value – Prior Month Value) prior Month Value 100
The methods used to discover these growths vary, despite the fact that they measure similar concepts. The monthly growth rate calculation formula is easier than the compound monthly growth rate. However, you should know how to do both will help you develop in your job.
Let’s understand this with the help of an, e.g., Suppose Jennifer Lisa had started a new restaurant business selling Pizzas in his locality in the month of January. In January, she sold a total of 3000 pizzas.
On February 28th, she calculated the month’s total sales, which stood at 4000 pizzas. So, what is Jennifer Lisa’s month-over-month growth? The month-over-month growth can be calculated as follows:
Month-Over-Month Growth (MoM) =4000 3000 – 1
=1.33 – 1
=0.33 100
=33%

Compounding monthly growth rate, or CMGR, is the average monthly increase over a longer time period, usually 6 to 18 months.
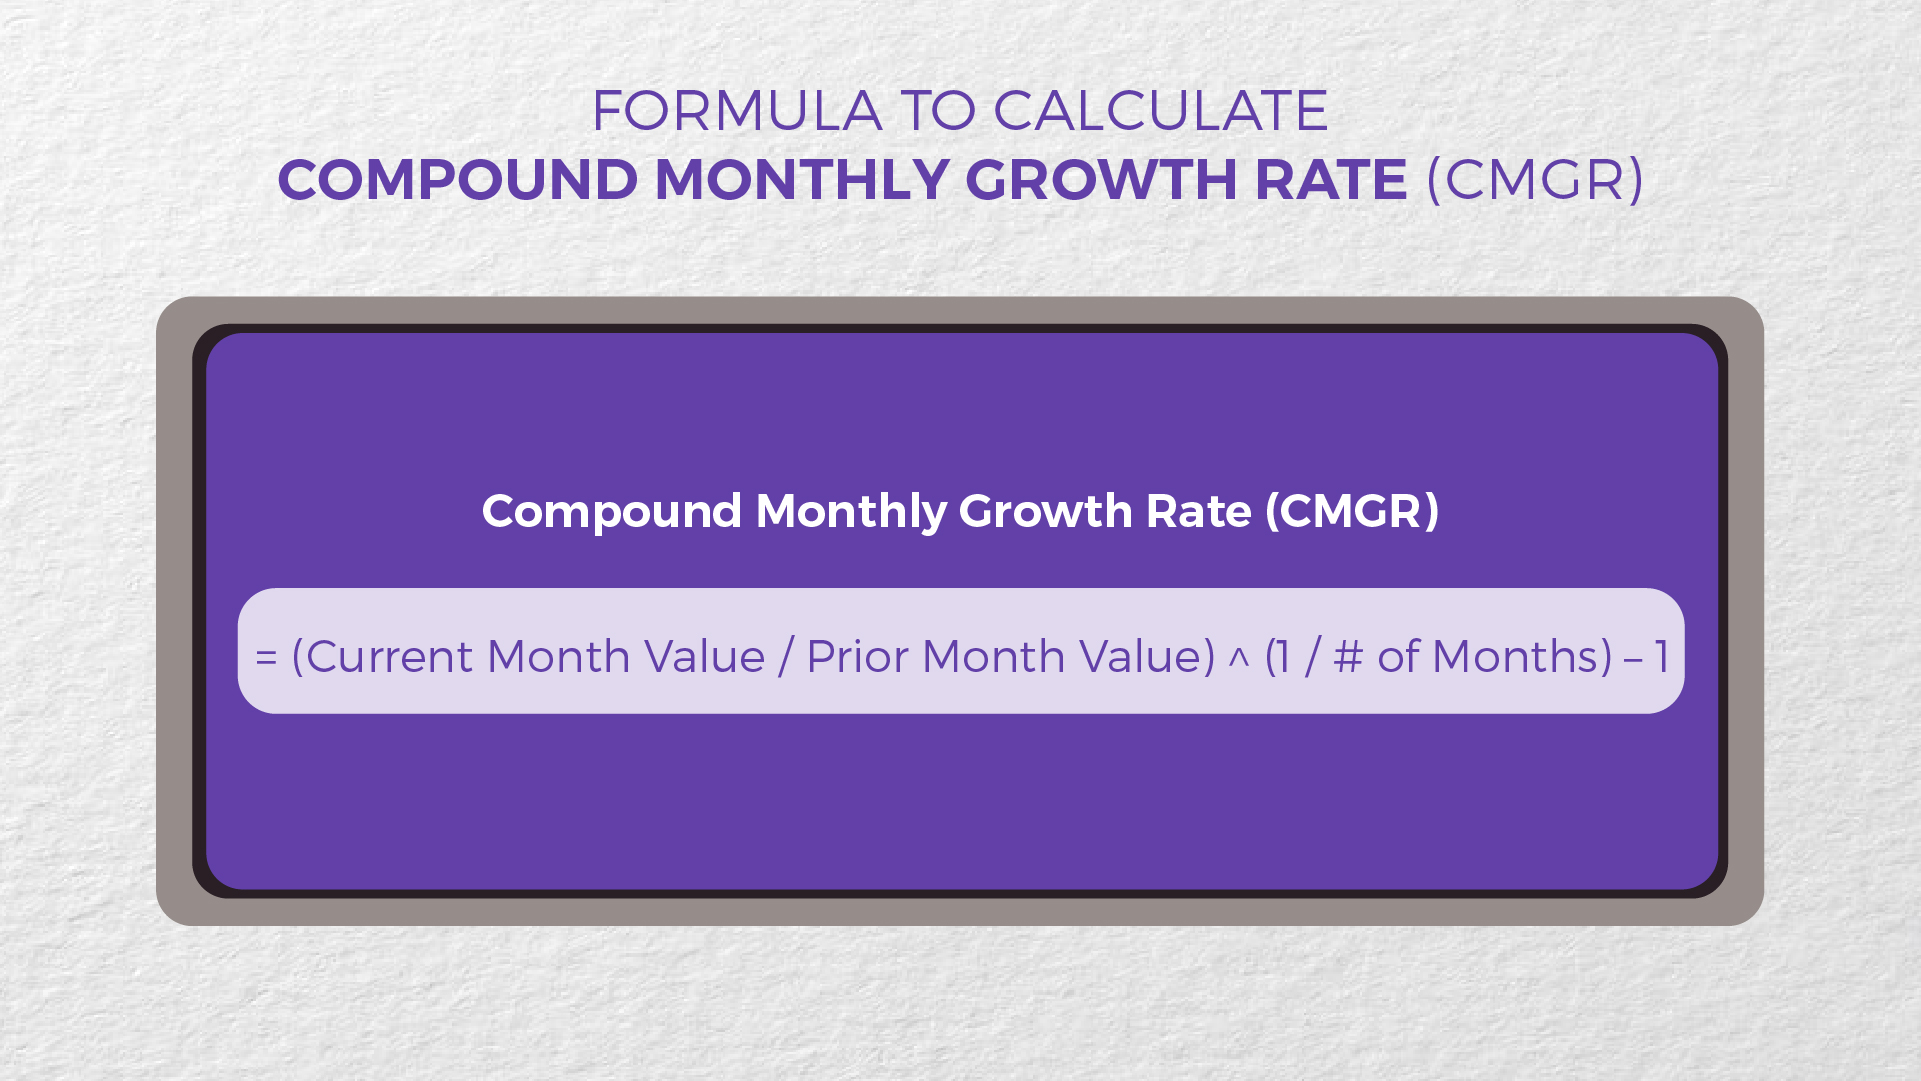
The formula for calculating compound monthly growth rate (CMGR) is
Compound Monthly Growth Rate (CMGR)
= (Current Month Value / Prior Month Value) ^ (1 / # of Months) – 1
Your CMGR, which assumes that your growth occurs at a steady rate each month over that time, describes your growth rate over a specific period.
Let’s say the restaurant owner Jennifer Lisa in the aforementioned scenario believes that a single month’s increase will not be enough to justify the size of their investment. She wants to observe the annual growth rate for the last five months. In essence, they are requesting the compound monthly growth rate, which is calculated using the method.
Month | Total Number of Sales |
January | 3000 |
February | 4000 |
March | 4200 |
April | 5000 |
May | 6000 |
Compound Monthly Growth Rate (CMGR) =(6000/3000)^(¼)-1
= 2^(¼)-1
= 0.189
= 18%
The gold standard of growth marketing is essentially sustained exponential growth. The exponential expansion cannot be faked.
Additionally, even if you succeed, the truth will ultimately come out, and that discrepancy may give off the impression that you lack the expertise of potential investors.
The change in a metric’s value, such as revenue or the number of active users, represented as a percentage of the value from the previous month is shown by the month-over-month growth rate. Understanding the cyclicality of a company’s performance is one of the key use cases for determining the monthly growth rate for mature organizations.
For early-stage businesses, the monthly growth rate is extremely crucial to monitor because, because of their rapid development rates, measures like run rate revenue are predicated on recent performance.
The monthly growth rate is determined in two steps as follows:
Finding the KPIs that are worth reporting on in your company’s wide range of data might be difficult for growth marketers.
For this reason, a lot of people report on vanity metrics. The following are the three KPIs that we believe mobile marketers should be tracking:
The KPIs for your company will determine this metric. Even though your service may be freemium, upgrading users to paid accounts is a crucial indicator to monitor MOM because unpaid users still cost money.
Opt-ins and sign-ups are other popular conversion rates to monitor. The quantity of sign-up conversions is a north star statistic to measure MOM if you work as a mobile marketer for a news organization, media outlet, or other company with a content creation staff.
For the durability of your business, it is essential to understand your app’s retention rate. Because they devote the majority of their resources to attracting new clients rather than making the necessary expenditures and efforts to keep them, many firms fail.
Customer acquisition figures may occasionally mask a sharp decrease in retention that occurs shortly afterward, but unless retention is increasing concurrently with the acquisition, the losses from acquisition expenditures will mount quickly.
Monthly active users are to the product team and monthly recurring income is to the business team. One of the best ways to identify a successful business model is to have substantial MRR growth together with MAU growth.
This might also indicate a high infectious coefficient and expanding network effects.
It’s extremely simple to make casual errors when developing your growth model. Even while the most frequent mistakes are usually little, they can quickly accumulate and snowball into existential issues that are much more difficult to resolve.
The top three mistakes people make with their growth data are listed below.
With smaller numbers, it is considerably simpler to produce large MoM growth. As a result, it’s both simpler to create a story around your MoM growth for low numbers and more challenging to maintain that rate as your organization expands.
In this illustration, from January to May, you can observe monthly growth of 18%. However, in terms of absolute numbers, you are simply referring to the increase in sales from 3000 to 6000 active users.
The issue is that this rate of growth doesn’t scale; one press mention can increase the number of monthly sales from 3000 to 6000. However, you need a strong growth engine to achieve the same 18%.
Working with tiny absolute numbers allows you to monitor MoM, but you should wait to discuss it until you have a higher, more consistent volume of users.
Your best bet up until that point is to concentrate on the underlying principles that determine whether growth will last over the long term by examining engagement metrics, stickiness, and user behavior data.
Growth is not always predictable. Your MAU may double one month and remain flat the following month. If that’s the case, modeling your erratic growth as a consistent CMGR is a mistake.
Imagine for a moment that you have an 18% CMGR but only sometimes approach 18%. (from January to May). The result is that you are unsure of your growth rate for the following month, let alone having continuous growth of 18% MoM.
Although the growth rate is inconsistent, the data is still telling you that your app lacks a reliable growth engine. Furthermore, it’s likely that you are unable to distinguish between months of growth and months of no growth.
Your company is expanding, and it is expanding steadily. That’s incredible! Just be careful not to confuse exponential growth with linear growth. Growth is not always equal.
If your growth is linear, embrace it and appropriately express it by mentioning its monthly increase in the total number of users. Utilize those findings later to find chances to enable nonlinear growth.
!REMEMBER!
When you employ month-over-month growth to precisely model present performance as well as benchmark and forecast success, it is the gift that keeps on giving. It conveys that you are confident in your abilities and dedicated to the long-term success of your business.
Most likely, your investors aren’t new to this. Keep in mind that the connection between investors and startups is frequently one that lasts a long time.
This is true for growth data: Even unintentionally misrepresenting your MoM might damage your reputation with some of your most significant stakeholders. Regardless of what it is, there is always a chance to get the respect of investors by how you show your growth data.
Even if your growth statistics aren’t soaring at a rate of 35% MoM, you may still win over investors by exploring why that is and offering practical solutions to the problem.
By comparing this month’s events to last month’s, month-over-month only gives an overview of the state of growth. But it doesn’t reveal the whole tale.
To connect monthly patterns to your company’s KPIs and long-term goals, keep in mind to zoom out sometimes. Determining whether you’re on course to accomplish more ambitious goals like YoY benchmarks and quarterly or yearly KPIs, might help you stay goal-oriented.
Although flat or declining growth rates may be depressing, keep in mind that all of your data has worth, even if it’s not the data you want to see. Exponential growth doesn’t happen immediately, and it surely doesn’t happen on its own, not even for the unicorns out there.
Adopt the discipline of being brutally honest with yourself and pay attention to what your development rates are saying if you want to pursue success aggressively. That will probably enable you to discover fresh chances to get better.
You want to reach as many clients as you can with your product because it’s your baby. However, you must exercise patience while growing and stave off the urge to advance quickly.
Your chances of success over the long term are more likely to be hampered than improved by a false narrative of your month-over-month growth rate. Accurate growth models are required for even the finest products.
Therefore, don’t give up if your honest growth model yields no results. Be patient, be truthful, and use the growth data you have at your disposal to identify opportunities that can fuel ongoing exponential growth.
Customer Lifecycle Is a Complete Cycle of the Customer with the Business whereas Customer Journey focuses on specific paths or interactions. Assume a customer lifecycle

Welcome to the world of user activation software, where the secret sauce to unlocking the full potential of your product or service lies. In this
Have you ever wondered how businesses track user actions on their websites or apps? How do they measure the success of their marketing campaigns and

Have you ever wondered how users navigate through websites or apps? How do they seamlessly move from one screen to another, making decisions and accomplishing

Do you want to create a product that truly speaks to your customers? Are you looking for ways to gather valuable feedback and improve the

Ever wondered how often customers visit your online store before making a purchase? Or which promotional messages drive higher-value sales? User behavior segmentation holds the